In this tutorial, I will explain how to populate dynamic column chart in PHP using Google chart API step by step. Google charts provide the flexibility to use the dynamic data using PHP inside the javascript code. With the help of Google chart, we can show the real-time data from the database in a graphical way, and also we can customize the graph as per our choice.
Below are the key points to know before using the Google chart
- Load the Google chart library as shown below.
<script src="https://www.gstatic.com/charts/loader.js"></script>
   <script>
    google.charts.load('current', {packages: ['corechart']});
    google.charts.setOnLoadCallback(drawChart);
   </script>
The first line of code indicates that it will load the loader for all chart types.
After the loader loads, you can call the google.charts.load function one or more times to load the chart type you want to display.
The current inside the function indicates the latest versions of released charts from Google and the corechart includes all the charts such as bar chart, column chart, pie chart, donut chart, etc.
- Prepare the data to be shown in the chart as shown below
var data = google.visualization.arrayToDataTable([
        ["Column1", "Column2"],
        ['Value1','Value2'],
      ]);
From the above code, we can get the all required data with the help of a javascript class called google.visualization.arrayToDataTable that contains the columns and rows.
- Customize the chart using options as shown below
var options = {
        title: "Title of the Graph",
        width: 800,
        height: 400,
        bar: {groupWidth: "45%"},
        legend: { position: "bottom" },
      };
whereas the title defines the title of the graph you want to display and the groupwidth defines the thickness of the columns shown in the chart.
Also, we can change the color of the columns that appear in the chart by passing the style role property inside the javascript class google.visualization.arrayToDataTable as shown below
var data = google.visualization.arrayToDataTable([
        ["Column1", "Column2",{role: 'style'}],
        ['Value1','Value2','color: #e5e4e2'],
      ]);
- Draw the chart. This is the final part of displaying the chart. In this step, we have to instantiate an instance of the chart class.
For example, if we want to show the column chart then we have to call the google.visualization.ColumnChart class and then we will use the draw function to draw the chart as shown below
var chart = new google.visualization.ColumnChart(document.getElementById("id of the HTML div element where you want to display"));
chart.draw(data, options);
Required steps to populate dynamic column chart in PHP
Step 1:- Create a table in your MySQL database.
DDL information of the table
CREATE TABLEcompany_info(idint(10) unsigned NOT NULL AUTO_INCREMENT,company_namevarchar(255) COLLATE utf8mb4_unicode_ci DEFAULT NULL,no_of_employeevarchar(255) COLLATE utf8mb4_unicode_ci DEFAULT NULL,created_attimestamp NOT NULL DEFAULT current_timestamp() ON UPDATE current_timestamp(),updated_attimestamp NOT NULL DEFAULT '0000-00-00 00:00:00',
PRIMARY KEY (id)
) ENGINE=InnoDB AUTO_INCREMENT=6 DEFAULT CHARSET=utf8mb4 COLLATE=utf8mb4_unicode_ci
Step 2:- Go to the root directory of the local server i.e. www and create a folder. In my case, the folder name is ‘charts’.
Step 3:- Create a database connection inside the charts folder.
connectdb.php:-
<?php
$servername='localhost';
$username="root";
$password="";
try
{
	$con=new PDO("mysql:host=$servername;dbname=test_db",$username,$password);
	$con->setAttribute(PDO::ATTR_ERRMODE,PDO::ERRMODE_EXCEPTION);
	//echo 'connected';
}
catch(PDOException $e)
{
	echo '<br>'.$e->getMessage();
}
?>
Below is the PHP code to retrieve the data from the database table.
<?php

$stmt=$con->query("select * from company_info order by id asc");
$stmt->execute();
$rows=$stmt->fetchAll(PDO::FETCH_ASSOC);

?>
Step 4:- Insert some data in the table by running the insert query as shown below
INSERT INTO `company_info`(`id`, `company_name`, `no_of_employee`, `created_at`, `updated_at`) VALUES ([value-1],[value-2],[value-3],[value-4],[value-5]);
Step 5:- Create an index.php file inside the charts folder to show the column chart.
index.php:-
<?php
include('connectdb.php');
//fetch data from the table
$stmt=$con->query("select * from company_info order by id asc");
$stmt->execute();
$rows=$stmt->fetchAll(PDO::FETCH_ASSOC);
?>
<html>
<head>
<title>Google Chart</title>
<link rel="stylesheet" href="https://maxcdn.boot strapcdn.com/bootstrap/3.4.1/css/bootstrap.min.css">
<style>
.container{
width:60%;
height:30%;
padding:20px;
}
</style>
</head>
<body>
<div class="container">
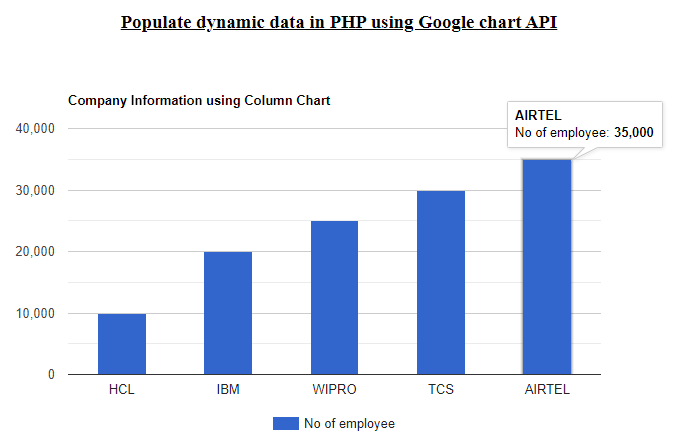
<h3 align="center"><u>Populate dynamic data in PHP using Google chart API</u></h3>
<div id="columnchart_values">
</div>
<br/><br/>
</div>
<!-- jQuery library -->
<script src="https://ajax.googleapis.com/ajax/libs/jquery/3.5.1/jquery.min.js"></script>
<!-- Latest compiled JavaScript -->
<script src="https://maxcdn.bootstrapcdn.com/bootstrap/3.4.1/js/bootstrap.min.js"></script>
<script type="text/javascript" src="https://www.gstatic.com/charts/loader.js"></script>
<script type="text/javascript">
google.charts.load("current", {packages:['corechart']});
google.charts.setOnLoadCallback(drawChart);
function drawChart() {
var data = google.visualization.arrayToDataTable([
["Company", "No of employee"],
<?php
foreach($rows as $key=>$value){
echo "['".$value['company_name']."',".$value['no_of_employee']."],";
}
?>
]);
//customize the chart
var options = {
title: "Company Information using Column Chart",
width: 800,
height: 400,
bar: {groupWidth: "45%"},
legend: { position: "bottom" },
};
var chart = new google.visualization.ColumnChart(document.getElementById("columnchart_values"));
chart.draw(data, options);
}
</script>
</body>
</html>
Step 6:- Open the browser and enter the below URL
http://localhost/charts/index.php
Also read, Integrate Instamojo payment gateway in PHP step by step
Conclusion:- I hope this tutorial will help you to understand the concept of Google chart creation. If there is any doubt then please leave a comment below