Hi friends, in this tutorial, you will learn how to draw a horizontal bar chart using Chart JS. Actually drawing a horizontal bar chart is the same as drawing a normal bar chart but the only difference is setting up the axis to ‘y’ in the options array.
Also read, How to draw a bar chart step by step using Chart JS
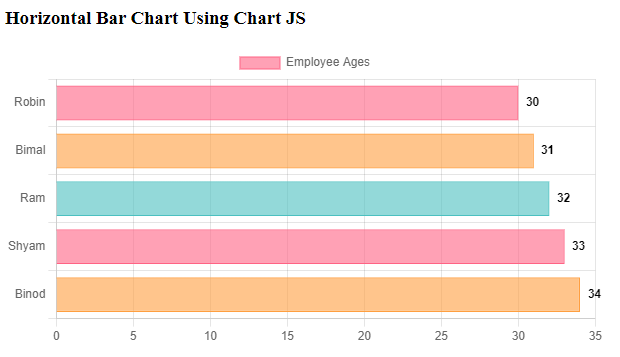
Also, you can show the bar values without the mouse hovering at the right side of each bar. So, let us take an example that demonstrates the employee ages corresponding to each of the employees. In order to draw the chart, please follow the below steps.
Required steps to draw a horizontal bar chart using Chart JS
Step 1:- Create an HTML file inside the root directory of your local server i.e. www.
Step 2:- Now, go to Google and search for chartjs plugin datalabels and copy the plugin src links, and paste into the head section of the HTML file as given below.
<script src="https://cdn.jsdelivr.net/npm/chart.js@3.0.0/dist/chart.min.js"></script>
<script src="https://cdn.jsdelivr.net/npm/chartjs-plugin-datalabels@2.0.0"></script>
Step 3:- Now, create a div inside the HTML file to display the chart as given below.
<div style="width: 600px; height: 400px;">
        <canvas id="fruitPricesChart"></canvas>
</div>
Step 4:- Now, paste the below javascript code inside your HTML file.
<script>
        // Fruit data
        // Register the plugin to all charts:
        Chart.register(ChartDataLabels);
        const fruits = ['Mango', 'Banana', 'Apple', 'Grape', 'Orange'];
        const prices = [30, 50, 80, 90, 100];

        // Create the bar chart
        const ctx = document.getElementById('fruitPricesChart').getContext('2d');
        const chart = new Chart(ctx, {
            type: 'bar',
            data: {
                labels: fruits,
                datasets: [{
                    label: 'Fruit Prices (Rs)',
                    data: prices,
                    backgroundColor: ['rgba(255, 99, 132, 0.6)', 'rgba(255, 159, 64, 0.6)', 'rgba(75, 192, 192, 0.6)'],
                    borderColor: ['rgba(255, 99, 132, 1)', 'rgba(255, 159, 64, 1)', 'rgba(75, 192, 192, 1)'],
                    borderWidth: 1
                }]
            },
            options: {
                plugins: {
                  // Change options for ALL labels of THIS CHART
                  datalabels: {
                    color: 'black',
                    font: {
                      weight: 'bold', // You can customize the font style
                    },
                    align:'top',
                    anchor: 'end',
                    display: true, // Display data labels on the bars

                  }
                },
                scales: {
                    y: {
                        beginAtZero: true,
                        ticks: {
                            stepSize: 10 // Adjust the step size of the y-axis ticks as needed
                        }
                    }
                }
            }
        });
</script>
Explanation of the javascript file
- First of all, you have to register the datalabels using the below command.
Chart.register(ChartDataLabels); // this is optional but if you want to show the bar values without mouse hover.
- Now, you have to create two arrays, one for showing the total employees which is Employees array and another is Ages to show the ages related to each employee.
- Now, you have to create a data array and options array with the help of a Chart object and pass the Employees array and Ages array inside the data array.
- Now set the indexAxis to ‘y’ which helps to display bar values without mouse hover.
- Now pass the plugins section inside the options array which contains the data label properties such as font style, color, alignment, anchor, etc of age values of each employee at the right side of the bar.
Complete Code:- (horizontal_bar_chart.html)
<!DOCTYPE html>
<html lang="en">
<head>
    <meta charset="UTF-8">
    <title>Fruit Prices Bar Chart</title>
    <!-- <script src="https://cdn.jsdelivr.net/npm/chart.js"></script> -->
    <script src="https://cdn.jsdelivr.net/npm/chart.js@3.0.0/dist/chart.min.js"></script>
    <script src="https://cdn.jsdelivr.net/npm/chartjs-plugin-datalabels@2.0.0"></script>
</head>
<body>
    <h3>Horizontal Bar Chart Using Chart JS</h3>
    <div style="width: 600px; height: 400px;">
        <canvas id="employeeChart"></canvas>
    </div>

    <script>
        // Fruit data
        // Register the plugin to all charts:
        Chart.register(ChartDataLabels);
        const Employees = ['Robin', 'Bimal', 'Ram', 'Shyam', 'Binod'];
        const Ages = [30, 31, 32, 33, 34];

        // Create the bar chart
        const ctx = document.getElementById('employeeChart').getContext('2d');
        const chart = new Chart(ctx, {
            type: 'bar',
            data: {
                labels: Employees,
                datasets: [{
                    label: 'Employee Ages',
                    data: Ages,
                    backgroundColor: ['rgba(255, 99, 132, 0.6)', 'rgba(255, 159, 64, 0.6)', 'rgba(75, 192, 192, 0.6)'],
                    borderColor: ['rgba(255, 99, 132, 1)', 'rgba(255, 159, 64, 1)', 'rgba(75, 192, 192, 1)'],
                    borderWidth: 1
                }]
            },
            options: {
                indexAxis: 'y', //set the horizontal appearence
                plugins: {
                  // Change options for ALL labels of THIS CHART
                  datalabels: {
                    color: 'black',
                    font: {
                      weight: 'bold', // You can customize the font style
                    },
                    align:'end',
                    anchor: 'end',
                    display: true, // Display data labels on the bars

                  }
                },
                scales: {
                    y: {
                        beginAtZero: true,
                        ticks: {
                            stepSize: 10 // Adjust the step size of the y-axis ticks as needed
                        }
                    }
                }
            }
        });
    </script>
</body>
</html>
Now, open your browser and type https://localhost/horizontal_bar_chart.html, you will see the output as given below.
Conclusion:- I hope this tutorial will help you to understand the concept. If there is any doubt then please leave a comment below.