Hi friends, in this tutorial, you will learn how to draw a bar chart step by step using Chart JS. Actually drawing a bar chart is very easy, you can find many tutorials on Google either using the Google Chart library or the Chart JS library but a question arises when you want to display bar values on top of each bar.
Also, read, Populate dynamic column chart in PHP using Google chart API
In such a case, you can not get the simple method. You will get tutorials but those are a bit complex in order to display the bar values in a simple way, follow the below steps.
Steps to draw a bar chart using Chart js
Step 1:- Create an HTML file (barchart.html) in the root directory of your local server.
Step 2:- Go to Google and search for Chart js plugins data labels or visit here directly and copy the CDN links as given below and paste them into the HTML file you created in Step 1.
https://cdn.jsdelivr.net/npm/chartjs-plugin-datalabels@2.0.0    // exact version
https://cdn.jsdelivr.net/npm/chartjs-plugin-datalabels@2        // latest 2.x.x
Step 3:- Now, you need to add the below javascript tags in the HTML file before the body tag ends.
<script src="https://cdn.jsdelivr.net/npm/chart.js@3.0.0/dist/chart.min.js"></script>
<script src="https://cdn.jsdelivr.net/npm/chartjs-plugin-datalabels@2.0.0"></script>
Step 3:- Now, you have to register the chart data labels manually. Remember to put the below line inside the script tag of your HTML file as shown below.
// Register the plugin to all charts:Chart.register(ChartDataLabels);
Step 4:- Now, include the data labels under plugins inside the chart options while drawing the chart as shown below.
plugins: {
                  // Change options for ALL labels of THIS CHART
                  datalabels: {
                    color: 'black',
                    font: {
                      weight: 'bold', // You can customize the font style
                    },
                    align:'top',
                    anchor: 'end',
                    display: true, // Display data labels on the bars

                  }
 },
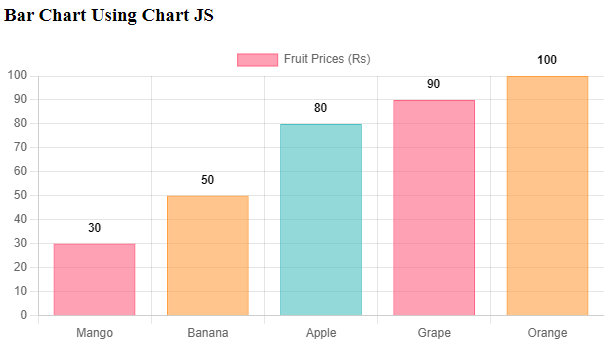
Step 5:- Now, I will draw a bar chart using chart js which displays the rate for each fruit as given in the below HTML file.
barchart.html
<!DOCTYPE html>
<html lang="en">
<head>
    <meta charset="UTF-8">
    <title>Fruit Prices Bar Chart</title>
    <!-- <script src="https://cdn.jsdelivr.net/npm/chart.js"></script> -->
    <script src="https://cdn.jsdelivr.net/npm/chart.js@3.0.0/dist/chart.min.js"></script>
<script src="https://cdn.jsdelivr.net/npm/chartjs-plugin-datalabels@2.0.0"></script>
</head>
<body>
    <h3>Bar Chart Using Chart JS</h3>
    <div style="width: 600px; height: 400px;">
        <canvas id="fruitPricesChart"></canvas>
    </div>

    <script>
        // Fruit data
        // Register the plugin to all charts:
        Chart.register(ChartDataLabels);
        const fruits = ['Mango', 'Banana', 'Apple', 'Grape', 'Orange'];
        const prices = [30, 50, 80, 90, 100];

        // Create the bar chart
        const ctx = document.getElementById('fruitPricesChart').getContext('2d');
        const chart = new Chart(ctx, {
            type: 'bar',
            data: {
                labels: fruits,
                datasets: [{
                    label: 'Fruit Prices (Rs)',
                    data: prices,
                    backgroundColor: ['rgba(255, 99, 132, 0.6)', 'rgba(255, 159, 64, 0.6)', 'rgba(75, 192, 192, 0.6)'],
                    borderColor: ['rgba(255, 99, 132, 1)', 'rgba(255, 159, 64, 1)', 'rgba(75, 192, 192, 1)'],
                    borderWidth: 1
                }]
            },
            options: {
                plugins: {
                  // Change options for ALL labels of THIS CHART
                  datalabels: {
                    color: 'black',
                    font: {
                      weight: 'bold', // You can customize the font style
                    },
                    align:'top',
                    anchor: 'end',
                    display: true, // Display data labels on the bars

                  }
                },
                scales: {
                    y: {
                        beginAtZero: true,
                        ticks: {
                            stepSize: 10 // Adjust the step size of the y-axis ticks as needed
                        }
                    }
                }
            }
        });
    </script>
</body>
</html>
Step 6:- Now open the browser type https://localhost/barchart.html and press ENTER and you will see the output which shows the bar values on top of each bar as shown in the below screenshots.
Conclusion:- I hope this tutorial will help you to understand the concept and draw a bar chart in a simple way.
Hi there! I’m at work surfing around your blog from my new iphone 4!
Just wanted to say I love reading through your blog and look
forward to all your posts! Carry on the great work!